
What works: One idea per post, specifics over safe takes, writing for the private share, treating comments as distribution, channel-native formats, and a path from every post to something you own.
What stops working: Formatting tricks. Hook lines, line breaks and the perfect posting time do not survive a board meeting, because none of them shows the audience is lowering the cost of pipeline.
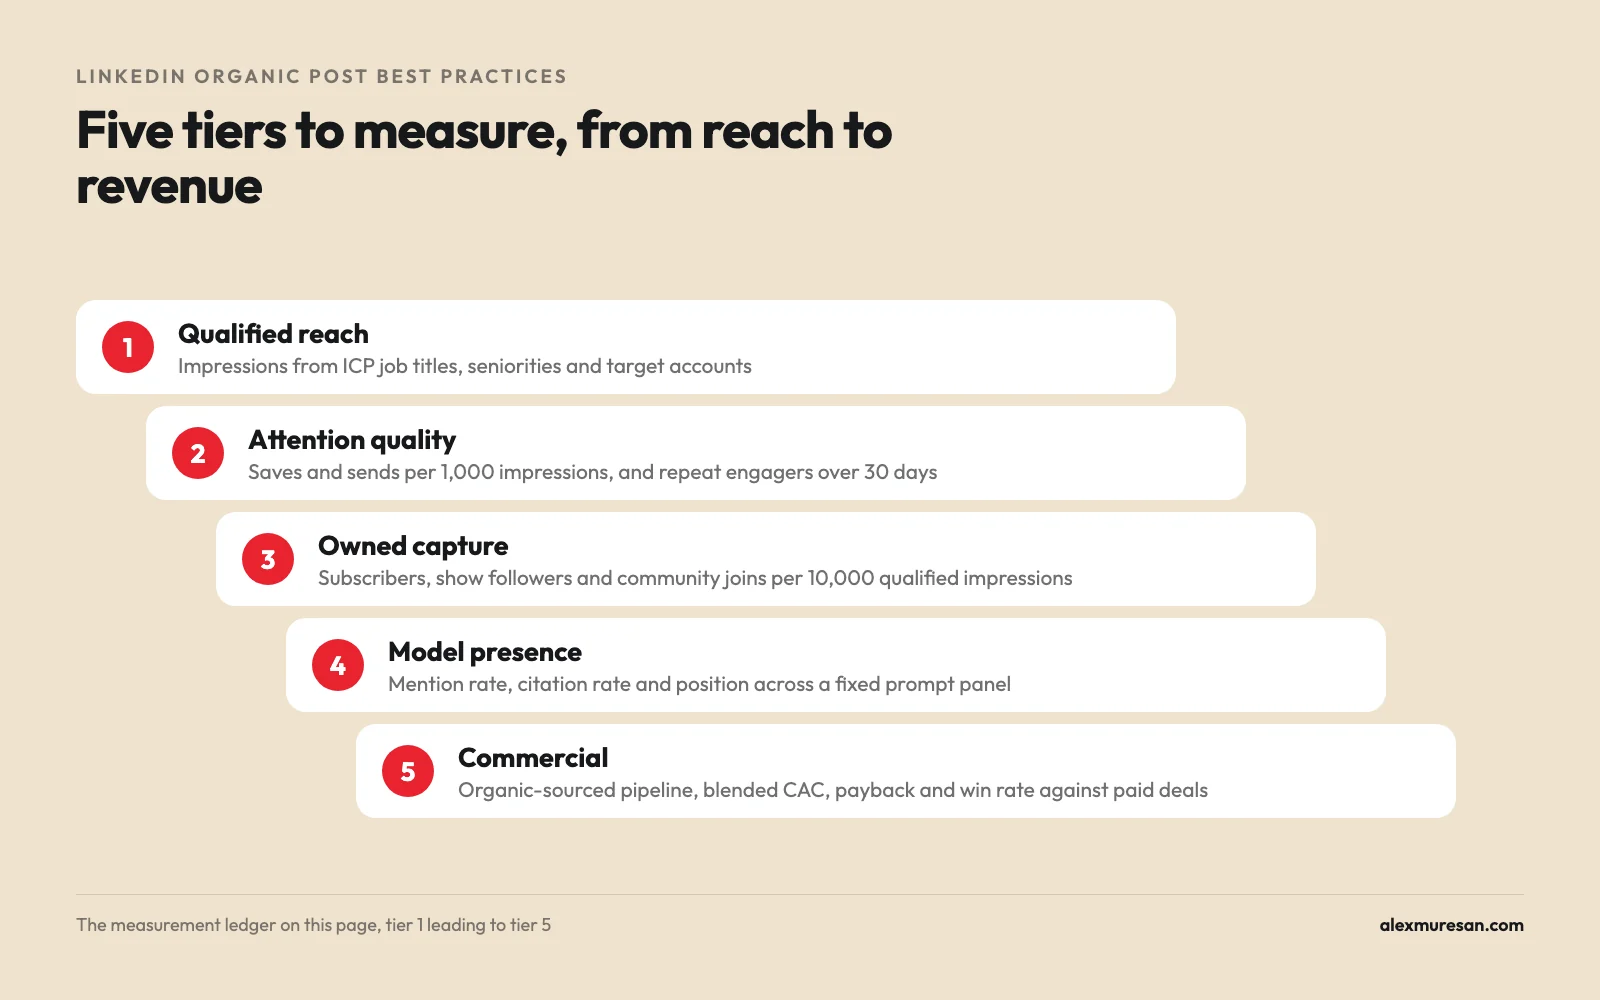
How to prove it: Measure cohorts, not months. A five-tier monthly ledger tracks qualified reach, attention quality, owned capture, model presence and commercial outcome, read on 90-day rolling averages.
What to avoid: Engagement pods and anything that inflates first-hour metrics. They raise impressions without raising the share that reaches buyers, and they make your measurement useless.

The LinkedIn organic post best practices that compound
Tools do not produce reach. These behaviors do, and each one is testable against your own data inside 60 days.
One post, one idea. If a reader cannot repeat your point in a sentence, it will not travel, so compression is the format.
Publish the specific, not the safe. Named numbers, real trade-offs and decisions you regret earn saves from buyers, while generic advice earns polite likes from peers.
Write for the private share. The most valuable engagement on LinkedIn is invisible: a send in DMs, a paste into Slack. Optimize for worth forwarding rather than worth liking.
Own the comment layer. Your reply is a second post with a warm audience attached, so treat comments as distribution rather than customer service.
Go channel-native. Documents, native video and plain text all behave differently, and repurposing a blog intro is compliance with a calendar, not distribution.
Build the capture layer before you scale reach. Every post needs a path to something you own, a newsletter, a show or a community, because reach you cannot contact again is reach you rented from the platform.
Publish source material AI models can quote. Frameworks, definitions, benchmarks and named methods get cited, and opinion without structure does not.
Test the folklore against your own data. External links, hashtags and posting times behave differently on every account, so run a four-week test on your own and trust it over any published rule, including the ones on this page.
Why formatting tricks stop working
Most LinkedIn advice is a list of formatting tricks. Hook lines. Line breaks. Post at 8:47 a.m. on a Tuesday. None of that survives contact with a board meeting.
What survives is a number: proof that the audience you built last quarter is lowering the cost of the pipeline you close next quarter. That is the whole game now. The click is dying, buyers ask models before they ask Google, and the only defensible position left is an owned audience plus a measurement framework that shows it compounds.
Rented attention vs owned audience
Paid reach is a lease. You pay, you get traffic, you stop paying, and nothing carries forward. Every month starts at zero with a slightly worse auction price than the one before.
Owned assets behave differently. A list, a show, a site and a body of public thinking all have a balance, and they keep paying out after you stop working on them. Ignore that long enough and you build up distribution debt, the compounding cost of every quarter spent renting reach instead of building it.
The second balance sheet: share of model
When a buyer asks ChatGPT, Claude, Perplexity or Google's AI Mode for the best vendors in your category, a model composes an answer from what it has absorbed and what it can retrieve. If your brand is not in that answer, you did not lose a click. You lost the consideration set before it existed.
That absence is the citation gap, and the presence you want is share of model: how often you are named, cited and recommended for the prompts your buyers actually type. LinkedIn is one of the sources answer engines draw on, which is why a post that defines something clearly can outlive its own feed.
Rising CAC is a creativity problem
Rising CAC gets treated as a budget problem: raise spend, tighten targeting, refresh creative, repeat. It is a creativity problem. Auctions get more expensive because everyone is buying the same attention with the same message, and the way out is an asset specific enough to spread on its own. When a larger competitor's lawyers sent Adam Robinson at RB2B a cease and desist, he posted the letter, and that one post pulled around 1,600 leads. No media budget buys that.
How to measure it: the monthly compounding ledger
This is the part that decides whether organic survives your next budget review. Five tiers, measured every month, read as trends rather than snapshots.
| Tier | What you measure | Why it matters |
|---|---|---|
| 1. Qualified reach | Share of impressions from ICP job titles, seniorities and target accounts, from LinkedIn's demographic breakdown, rather than raw impressions | Reach without fit is noise you are proud of |
| 2. Attention quality | Saves and sends per 1,000 impressions, "see more" expansions, substantive comments of 15 words or more, and the repeat engager rate over 30 days | Predicts whether an audience is forming or just passing by |
| 3. Owned capture | Subscribers, show followers and community joins per 10,000 qualified impressions, and the ICP share of new subscribers | Turns rented reach into an asset you can contact again for free |
| 4. Model presence | Mention rate, citation rate and average position across a fixed prompt panel, plus sentiment and how the category is framed | Your visibility in the answer layer where buyers now shortlist |
| 5. Commercial | Self-reported attribution share, organic-sourced pipeline, blended CAC, CAC payback, win rate and cycle length against paid-sourced deals | The lagging proof that the first four tiers are doing work |
The monthly cadence
Run it on the same five working days every month, with no improvisation.
Day 1, pull. Export post-level analytics and follower demographics from LinkedIn, direct and branded search from your web analytics, the self-reported attribution field from your CRM, and this month's prompt panel results.
Day 2, normalize. Convert everything to rates per 1,000 qualified impressions. Absolute numbers reward volume, and rates reward quality.
Day 3, trend. Compute 90-day rolling averages and never decide on a single month, because organic data is noisy at monthly resolution and the noise will make you kill your best work.
Day 4, cohort. Group posts by the month they were published and track the reach, capture and pipeline each cohort produces at 30, 60, 90 and 180 days. That compounding curve is the most persuasive chart you will ever put in front of a CFO.
Day 5, decide. Kill formats below the median on repeat engager rate and owned capture rate, double the ones above it, and write down exactly one hypothesis for next month before you run it.
Every quarter, add three things
Asset half-life: the percentage of this quarter's first touches that came from content published more than 90 days ago. A rising half-life is compounding made visible.
A paid pause test: turn off one paid channel in one segment for two to four weeks and measure the demand that remains. Nothing exposes borrowed credit for organic like a controlled pause.
The rented ratio: the share of last quarter's pipeline from channels that stop the moment you stop paying. Above 70% and you have a subscription, not a marketing engine, so track it as a line you are deliberately bending.
Track share of model with a prompt panel
Build a fixed panel of 25 to 40 buying prompts your customers would realistically type. Run them monthly across ChatGPT, Perplexity, Google's AI Overviews and AI Mode, and log whether you are mentioned, whether you are cited, where you appear and how you are described. That log is your baseline, and you cannot close a gap you have not sized.
Instrument self-reported attribution
Put one required field on your demo form: "How did you first hear about us?" Make it free text, not a dropdown. Multi-touch models under-credit anything with no click, which is exactly what LinkedIn organic, podcasts and AI answers are. Self-reported data is imperfect, and it is still the most accurate organic signal most companies will ever collect.
The arithmetic that wins the argument
This is illustrative, so use your own inputs, but the shape holds. Organic cost is largely fixed and its output is cumulative. If a $10,000 monthly organic program sources 2 customers in month one, that is $5,000 per customer, worse than most paid channels. If the same $10,000 sources 10 customers in month twelve, because the audience, the back catalogue and the model presence all kept accruing, it is $1,000 per customer. Paid runs the other way: hold spend flat and CAC drifts up as the auction gets more crowded. Plot both lines over 24 months and the crossover point is the decision, which usually arrives sooner than the room expects.
The metrics that predict long-term audience lift
Seven metrics, in rough order of how well they predict an audience that compounds.
Repeat engager rate over 30 days.
Saves and sends per 1,000 impressions.
The ICP share of net-new followers.
Owned capture rate, measured as subscribers per 10,000 qualified impressions.
The trend in branded search and direct traffic.
Share of model across your prompt panel.
Inbound conversations started by ICP contacts with no prior touch.
Impressions, likes and follower count are the four metrics most likely to be reported and least likely to predict anything.
The tools worth using, and what each one is for
Judge each tool on one question: does it help you build owned distribution, or help you rent attention more efficiently? Both can be useful, and only one changes your CAC curve. Check pricing on each vendor's own site, because it moves.
Sprout Social
A mature platform for publishing, engagement, listening and reporting across networks. Its reporting is genuinely useful when a team needs cross-channel numbers in one place. It is a distribution pipe rather than a point of view, and per-seat pricing makes broad executive participation expensive.
Loomly
A collaborative calendar with structured approvals, and the cheapest credible way to coordinate several contributors without email chaos. Approval workflows optimize for safety, though, and safety is why most B2B LinkedIn content is invisible.
Postiv AI
An AI-assisted LinkedIn drafting and scheduling tool that posts through LinkedIn's official methods rather than browser automation, which matters if you run client accounts. Speed multiplies whatever you already have, so use it to draft against a thesis you own, never to generate one.
LinkedIn Sales Navigator
LinkedIn's own prospecting product, and nothing else touches its first-party data on job changes, headcount and account movement. It creates no organic demand. It helps you reach people faster, which is only valuable if they already know who you are.
Hotjar
Behavior analytics for what happens after the click. Its on-page survey is one of the most valuable organic measurement tools available, because a single "how did you first hear about us?" question recovers attribution no analytics platform can model. It does nothing for publishing or distribution.
Sprinklr
A unified suite for social publishing, listening and care across a very large channel footprint, built for governance across hundreds of users and dozens of markets. It is heavy machinery for a job that mostly requires a sharp opinion published consistently.
The one to avoid: engagement pods
Tools like HyperClapper deliver likes and AI-written comments from a pool of accounts in a post's first hour. That inflates exactly the metrics you should be ignoring. It raises impressions without raising the share that reaches buyers, and it pollutes the data the ledger above depends on, which is a real cost rather than a style objection.
Getting help building it
Most teams do not need more content. They need a thesis, a channel-native format, a capture layer and a ledger that proves the whole thing compounds.
If you want the compounding ledger as a working template, scoped to your funnel and your CRM fields, ask me for it through the contact page. The first conversation is a distribution audit: what you own, what you rent, and what the rented part is costing you. If you want the free tooling first, YapCut is the open-source content engine I run on myself.
FAQs About LinkedIn Organic Posts
What are the best practices for LinkedIn organic posts? One idea per post, specific numbers and trade-offs over safe advice, writing for the private share in DMs and Slack, treating comments as distribution, channel-native formats, a path from every post to something you own, and source material structured so AI models can quote it.
How do you measure the compounding value of organic content? Measure cohorts, not months. Group posts by publication month and track the reach, subscribers and pipeline each cohort produces at 30, 60, 90 and 180 days. Normalize metrics per 1,000 qualified impressions, add a free-text attribution field to demo forms, track asset half-life, and read everything on 90-day rolling averages.
What metrics best predict long-term audience lift from organic posts? Repeat engager rate over 30 days, saves and sends per 1,000 impressions, the ICP share of new followers, owned capture rate, the branded search and direct traffic trend, share of model across a prompt panel, and inbound conversations from ICP contacts with no prior touch. Impressions, likes and follower count predict very little.
How do I build a monthly measurement framework for organic content? Run a five-day monthly cycle: pull raw data, normalize to rates per 1,000 qualified impressions, compute 90-day rolling trends, build cohort curves, then make kill-or-double decisions and set one hypothesis. Measure five tiers: qualified reach, attention quality, owned capture, model presence and commercial outcome.
What is the 4-1-1 rule on LinkedIn? A commonly cited content mix: for every six posts, share four pieces of other people's content, one soft promotional post and one hard sell. It is a useful check on relentless self-promotion, and it is a ratio rather than a strategy, because four forgettable shares still add up to four forgettable posts.
What is the 5-5-5 rule for social media? Definitions vary by source, which tells you most of what you need to know. It usually describes a short daily routine split between engaging with other people's posts, commenting and publishing your own. The principle that survives is that participating in other people's comment sections is free distribution.
What is the 70/20/10 rule in content marketing? It allocates roughly 70% of effort to proven core activity, 20% to emerging bets and 10% to genuine experiments. It is a reasonable default for balancing risk, and in practice most teams run something closer to 95/5/0, then wonder why nothing new ever compounds.
Is organic LinkedIn too slow when you need results now? Paid stops the moment payment stops, which is dependency rather than speed. A specific point of view published in public starts conversations in week one, and the compounding shows up later. The pipeline does not have to wait for the curve.
About the Author

Alex Muresan is a 4x founder with 2 exits. He built his first company, a physical entertainment center, to 60 employees and $2M in annual revenue in his early 20s. His second exit came in 2026, when he sold a media company. He took an AI startup from 0 to $600K ARR in 5 months, and at his current startup he took revenue from $800K to $1.4M ARR in his first 3 months. He also hosts Sell That S*it!, where every guest in season one is a VC.
Part of the stage playbooks: what to do for growth at pre-seed, seed, Series A, Series B and Series C. The glossary →